Analysing Urban Twitter Messages
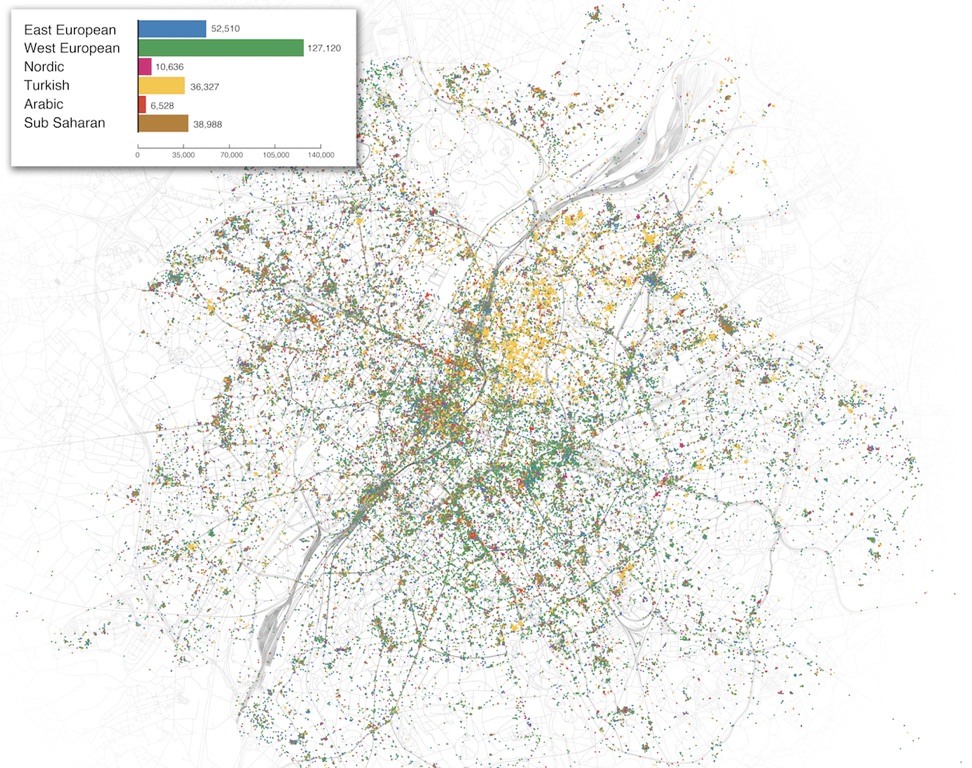
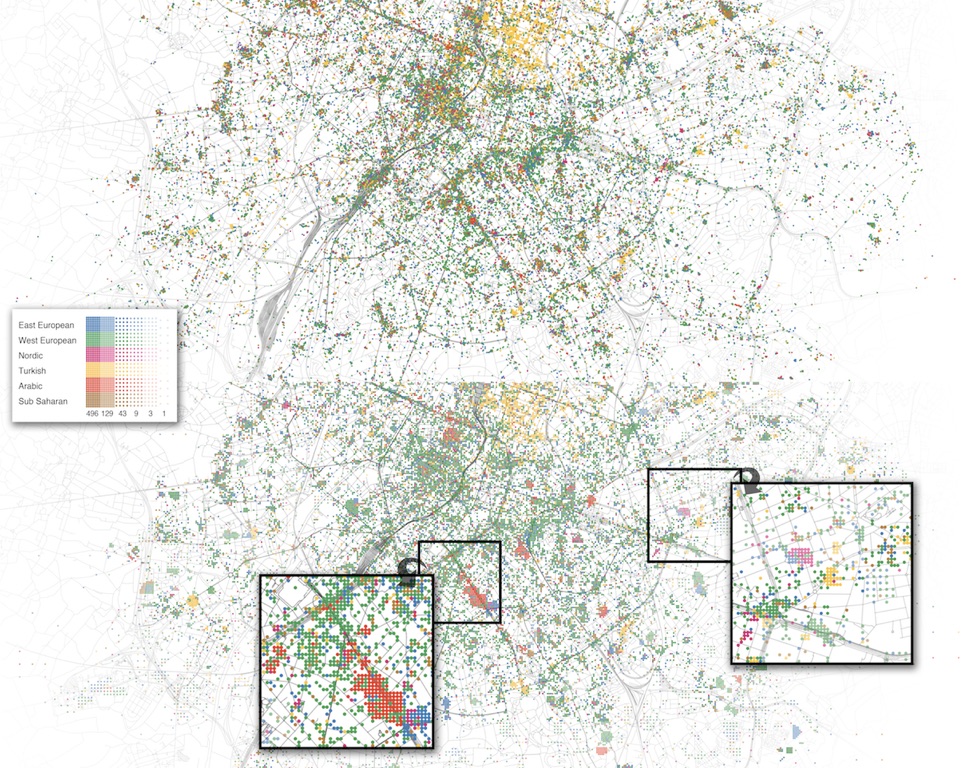
Dot maps have become a popular way to visualize discrete geographic data, like Twitter messages. Yet, beyond showing how the data are spatially distributed, dot maps are often visually cluttered in terms of consistency, overlap, and representativeness. We therefore developed BinSq, a novel visualization technique to compare variations in dot density patterns without visual clutter. Based on a careful synthesis of existing clutter reduction techniques, BinSq reduces the wide variety of dot density variations on the map to a representative subset of density intervals that are more distinguishable.
Publication
- Chua, A., Vande Moere, A. (2017). BinSq: Visualizing Geographic Dot Density Patterns with Gridded Maps. Cartography and Geographic Information Science, Vol. 44, Iss. 5, pp. 1-20