A Situated Data Visualization shows Analytical Sports Statistics on a Public Display
Will passers-by analyse complex data on a public display?
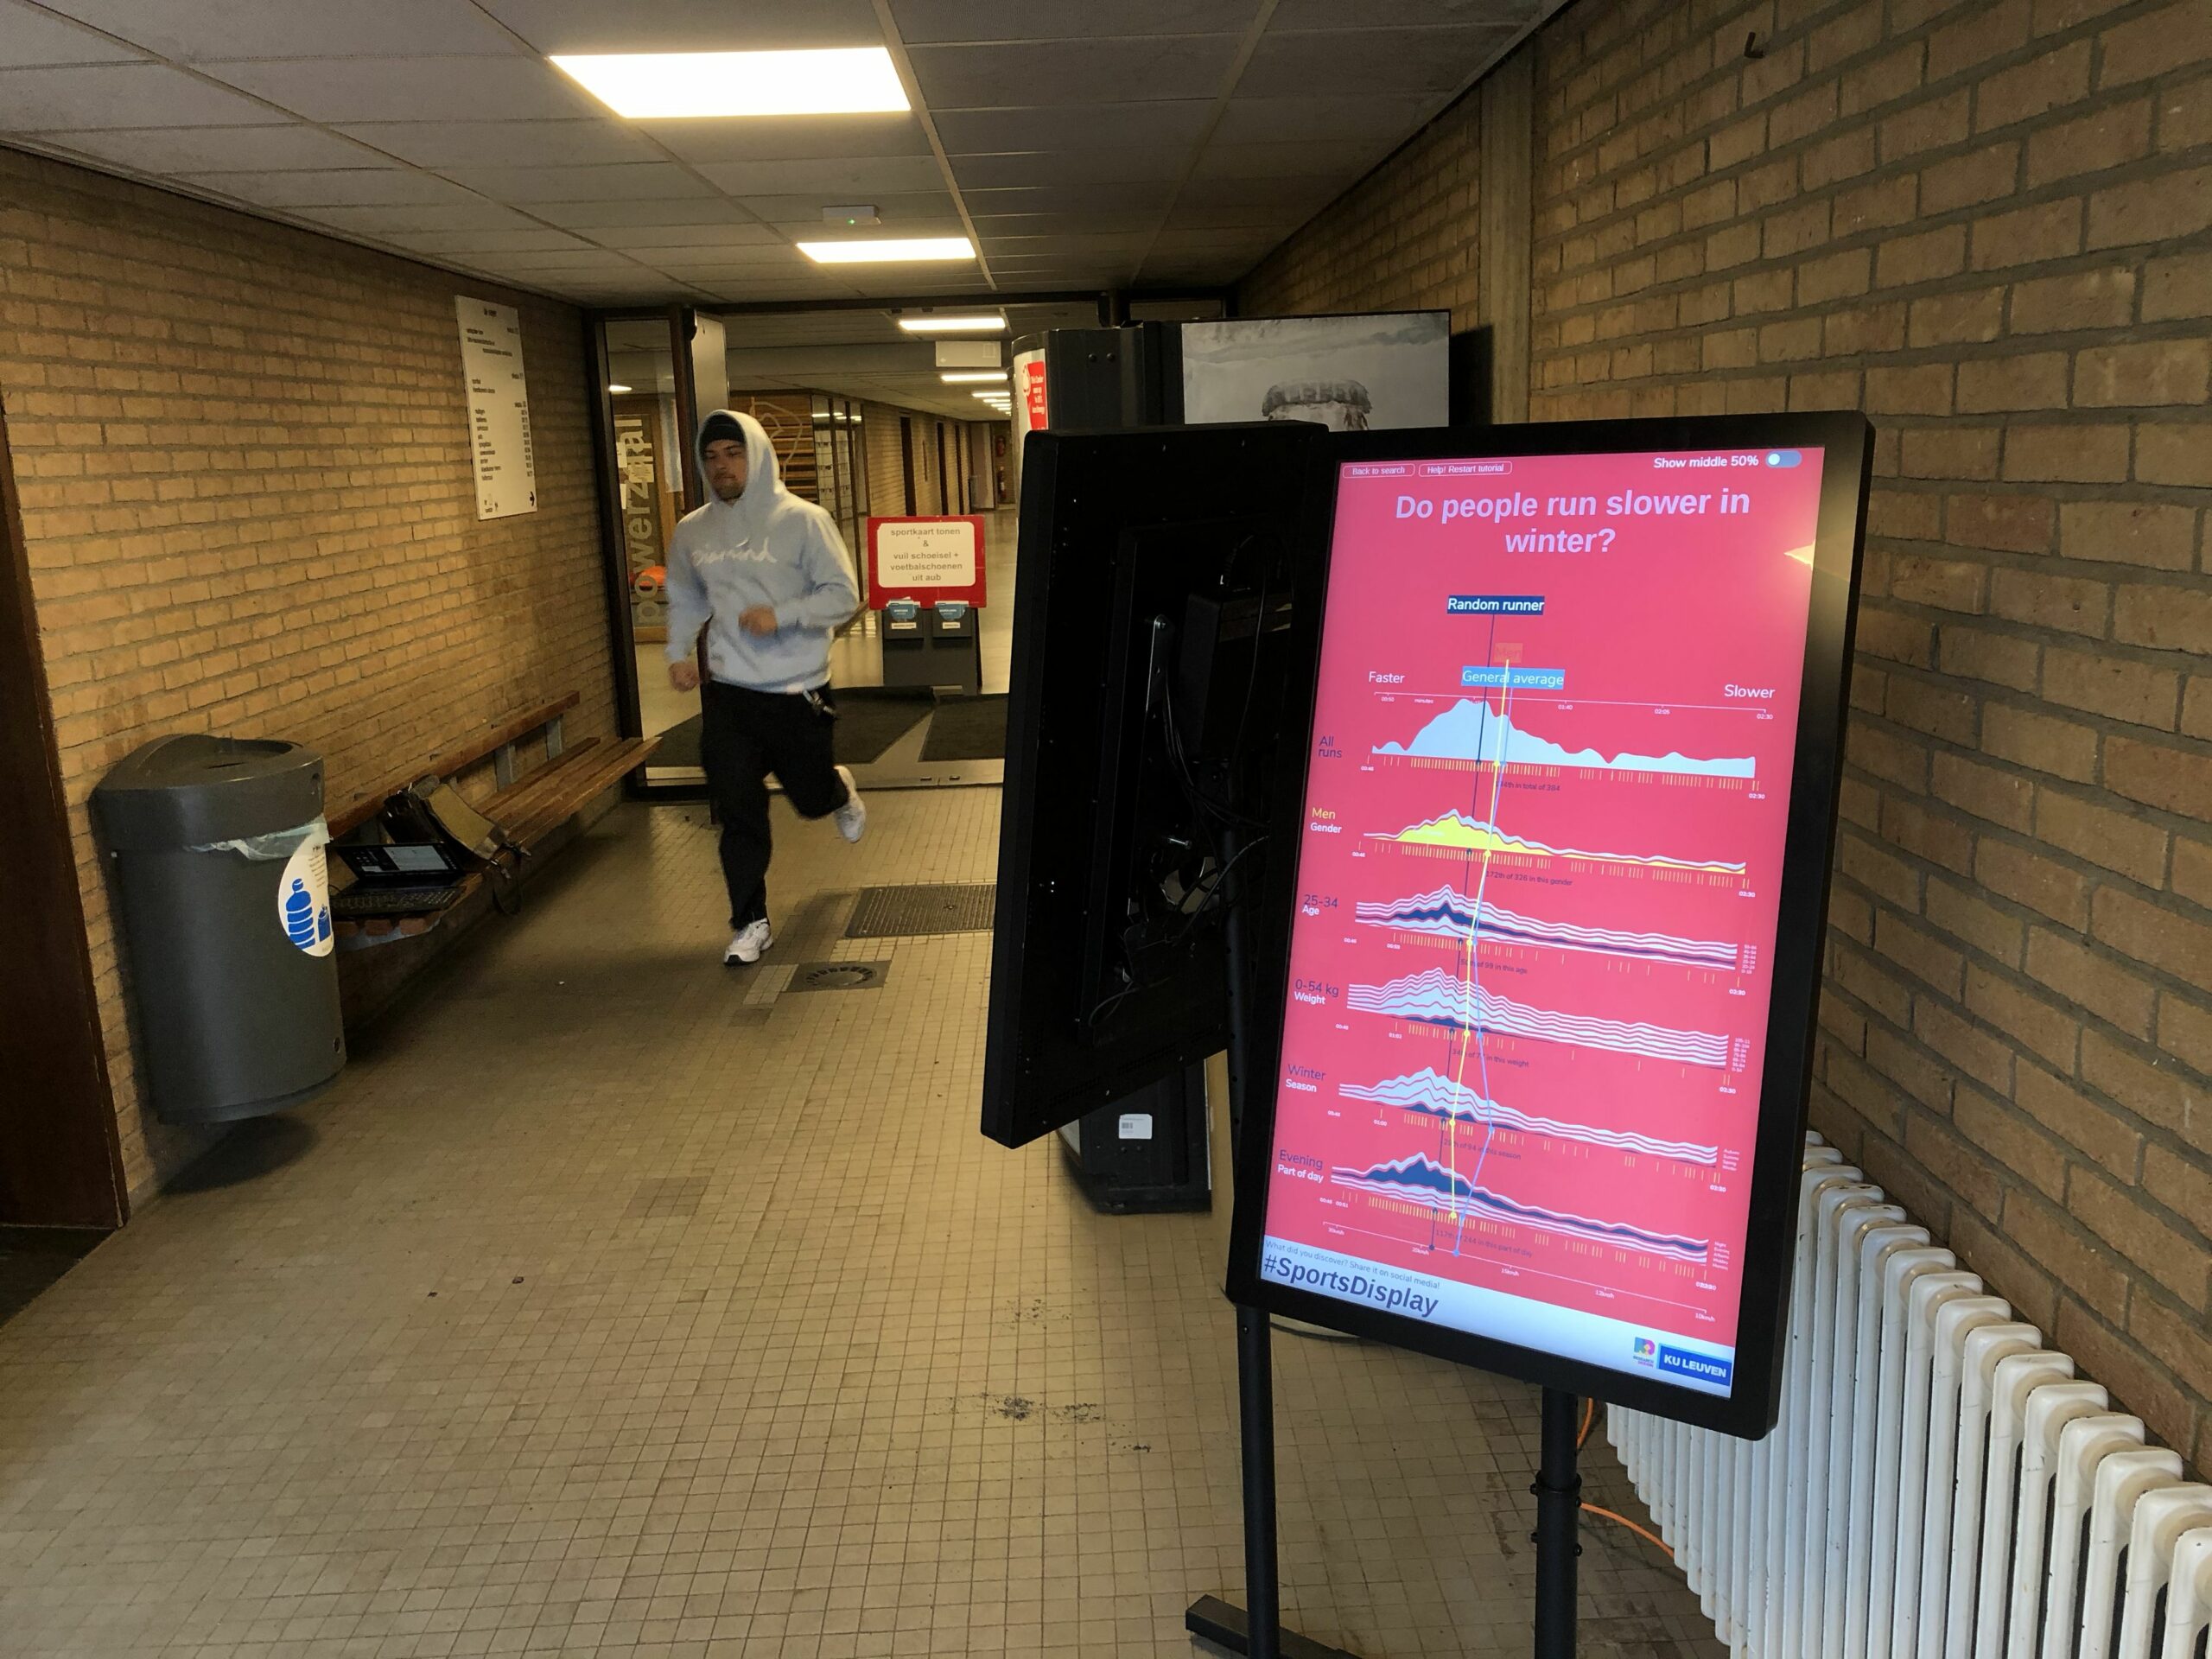
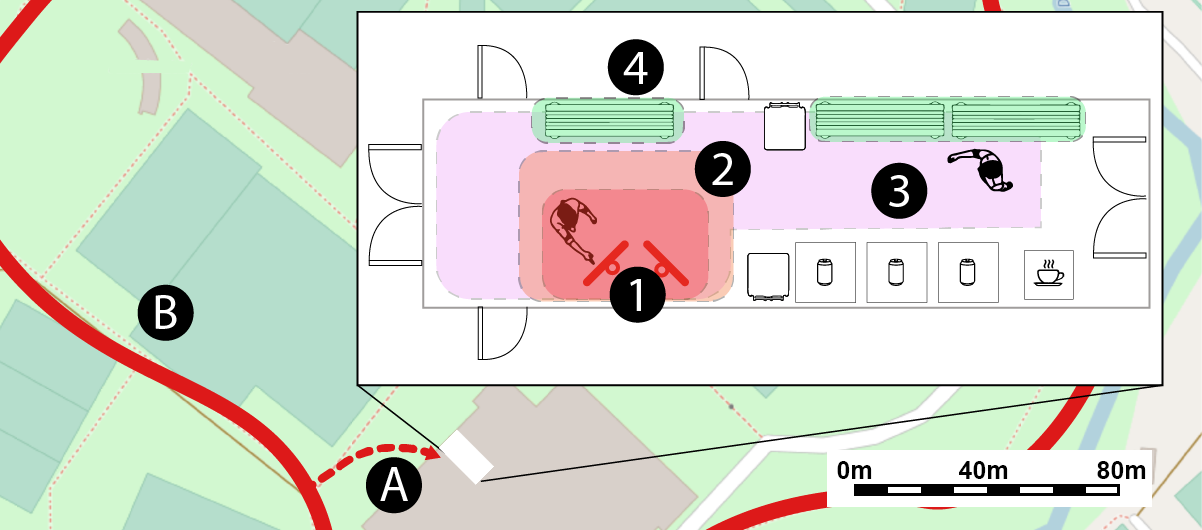
This research investigated the potential of ‘situating’ an analytical data visualization on a public display. We chose to visualise the sport performance of local runners on two touch-enabled public displays in the immediate physical proximity to a local community running trail.
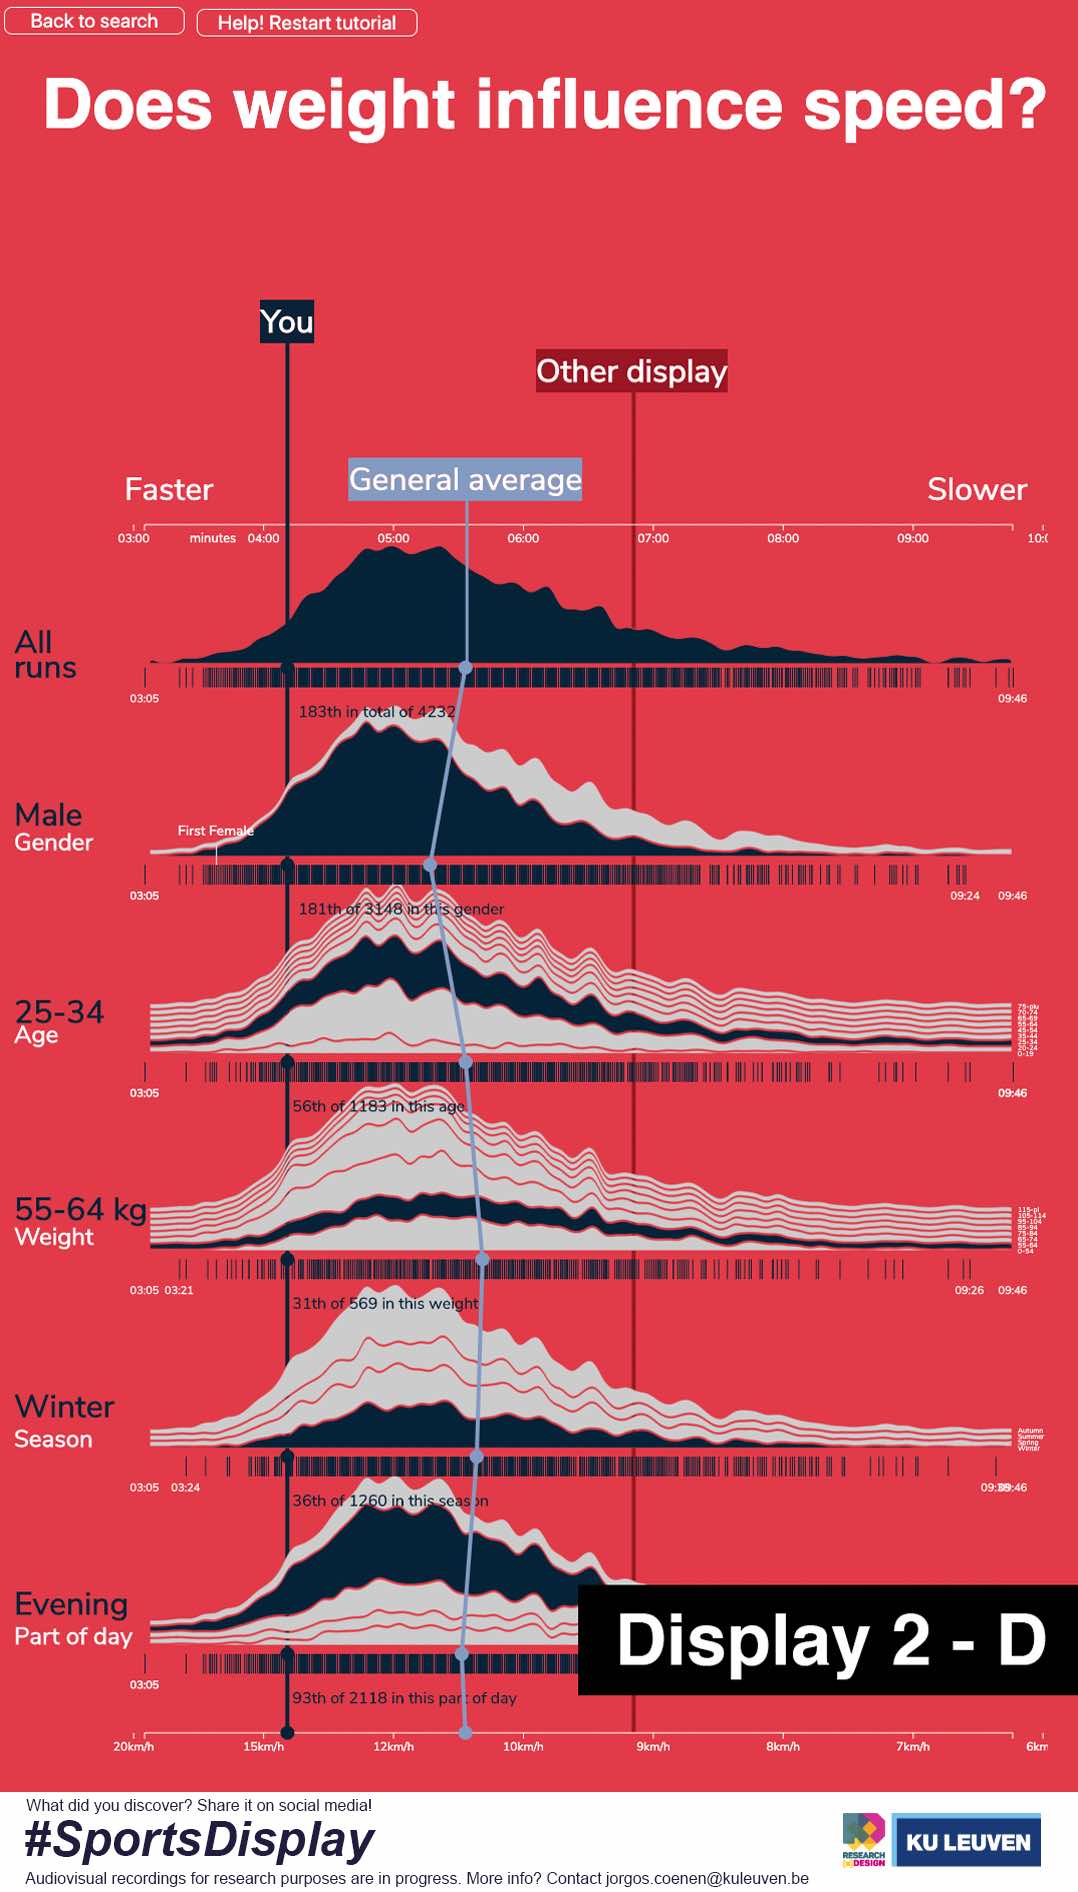
The visualised data was based on Strava, a popular social platform for tracking running and cycling activity. Its “Segment Leaderboard” API data can return a sufficiently sizeable dataset that contains the personal sports performances of the runners that frequent a particular running trail. For each run, the API provides access to data dimensions like first name and initials, date, time, age and weight categories and the gender of the runner. Based on the timestamp of the run, we added data attributes that denoted the weather and the part of day (i.e. morning, afternoon, evening, night).
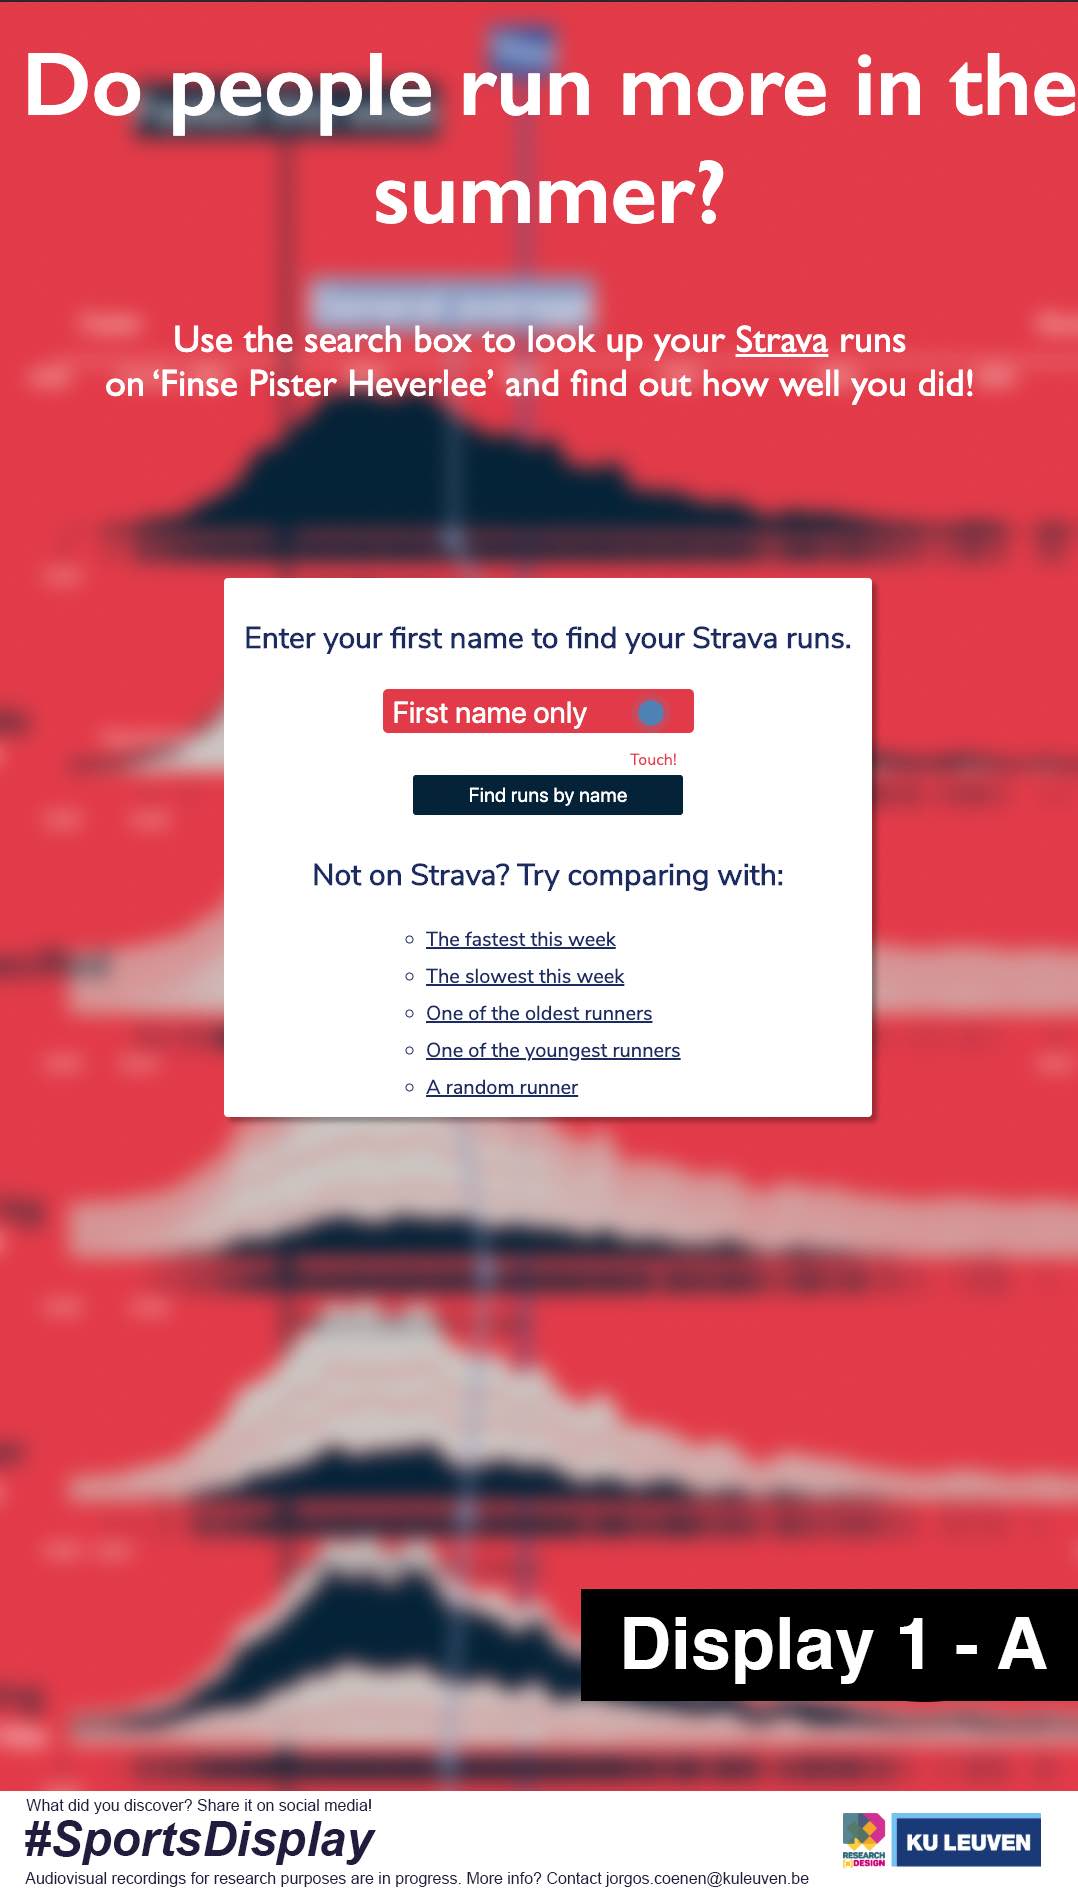
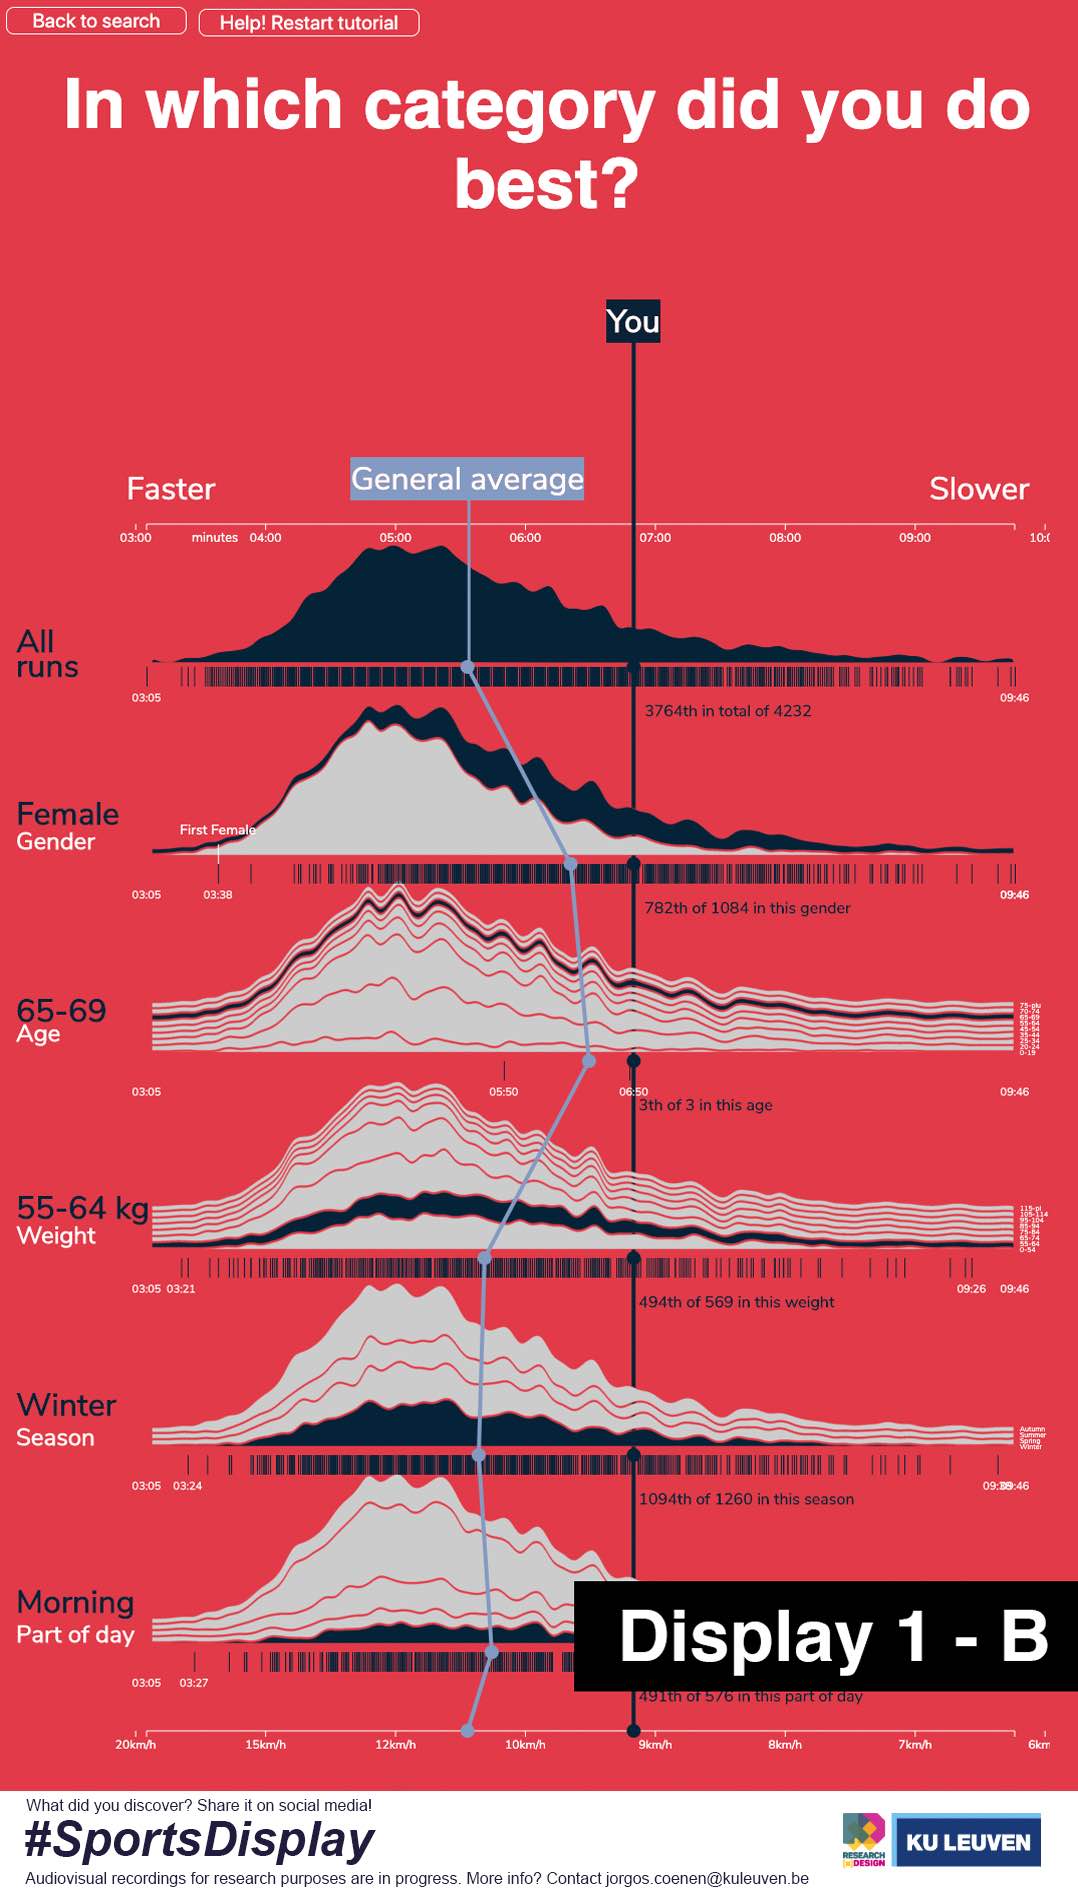
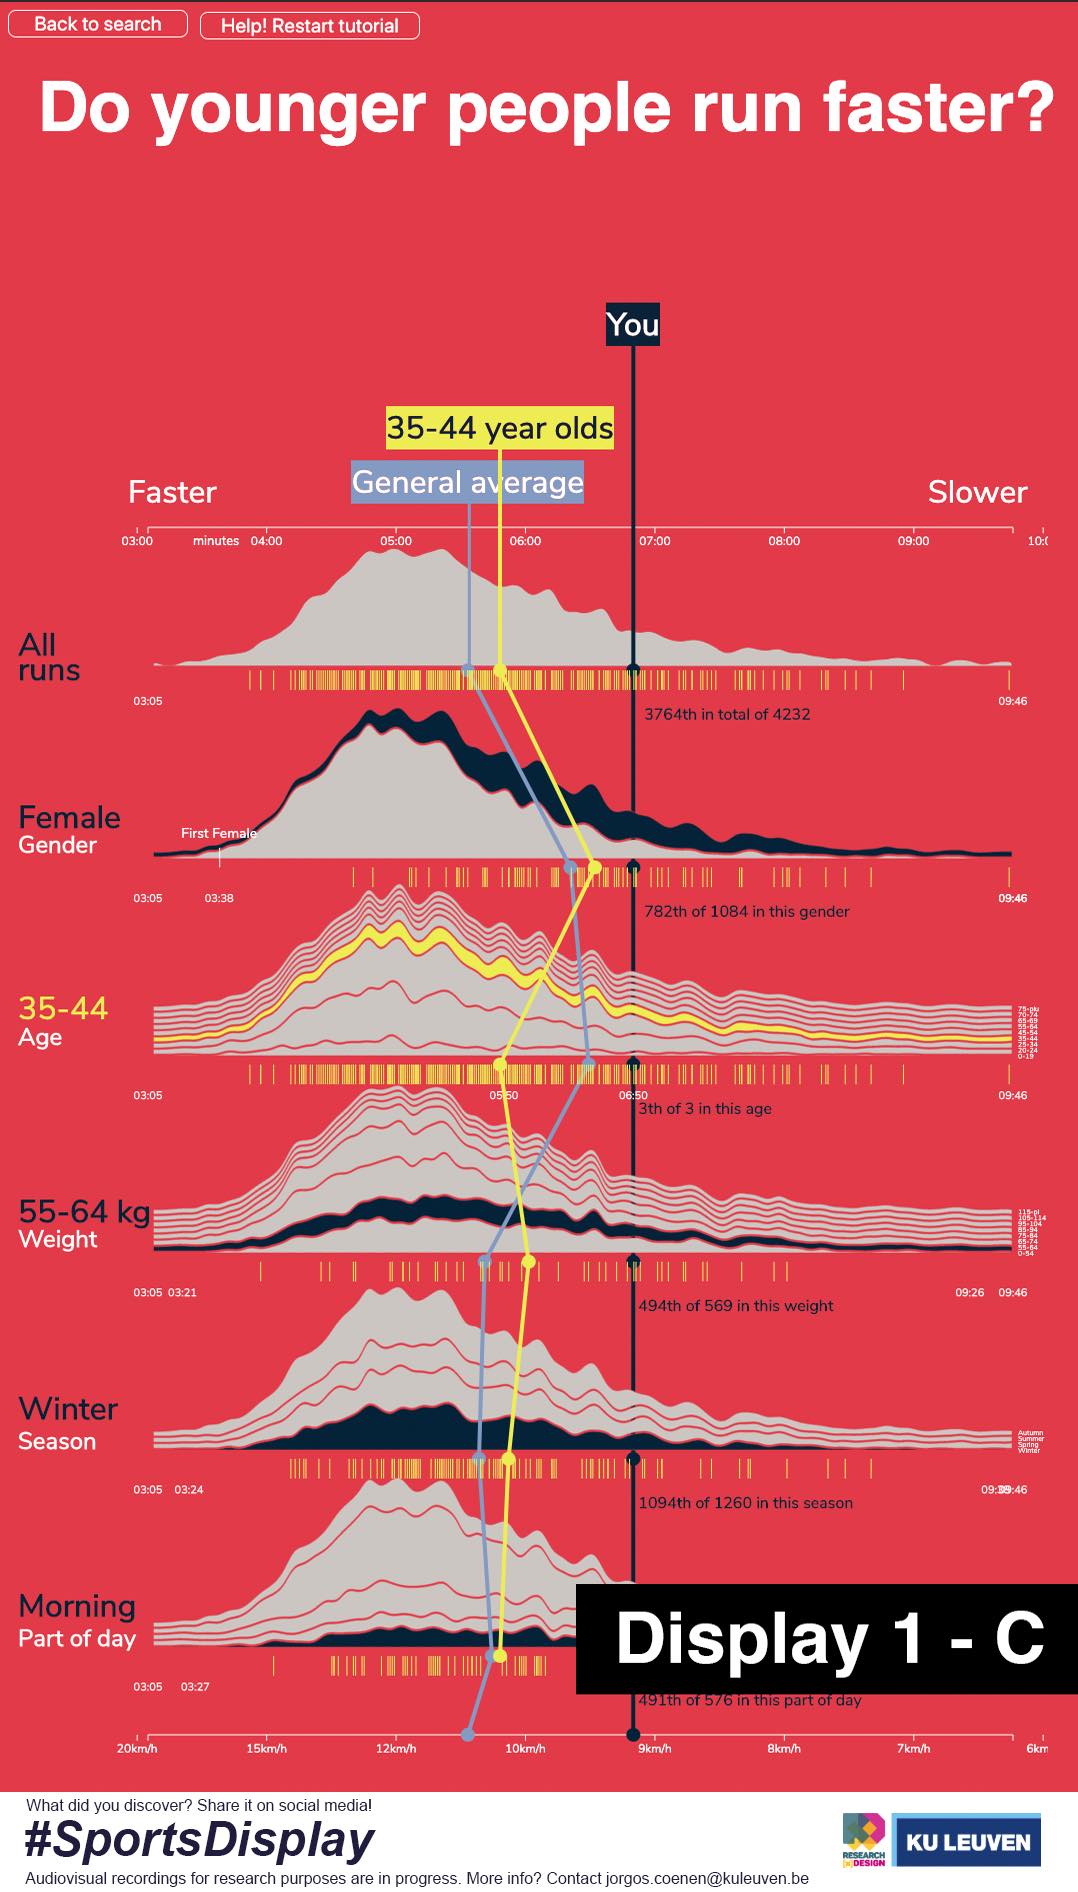
We then proceeded to develop a bespoke data visualisation that can be shown on a touch-enabled public display in portrait-mode. As such, the data visualisation shows curious call-to-actions, provides hints for interactivity, and allows interested passers-by to either explore general trends or look up and compare personal performance data.
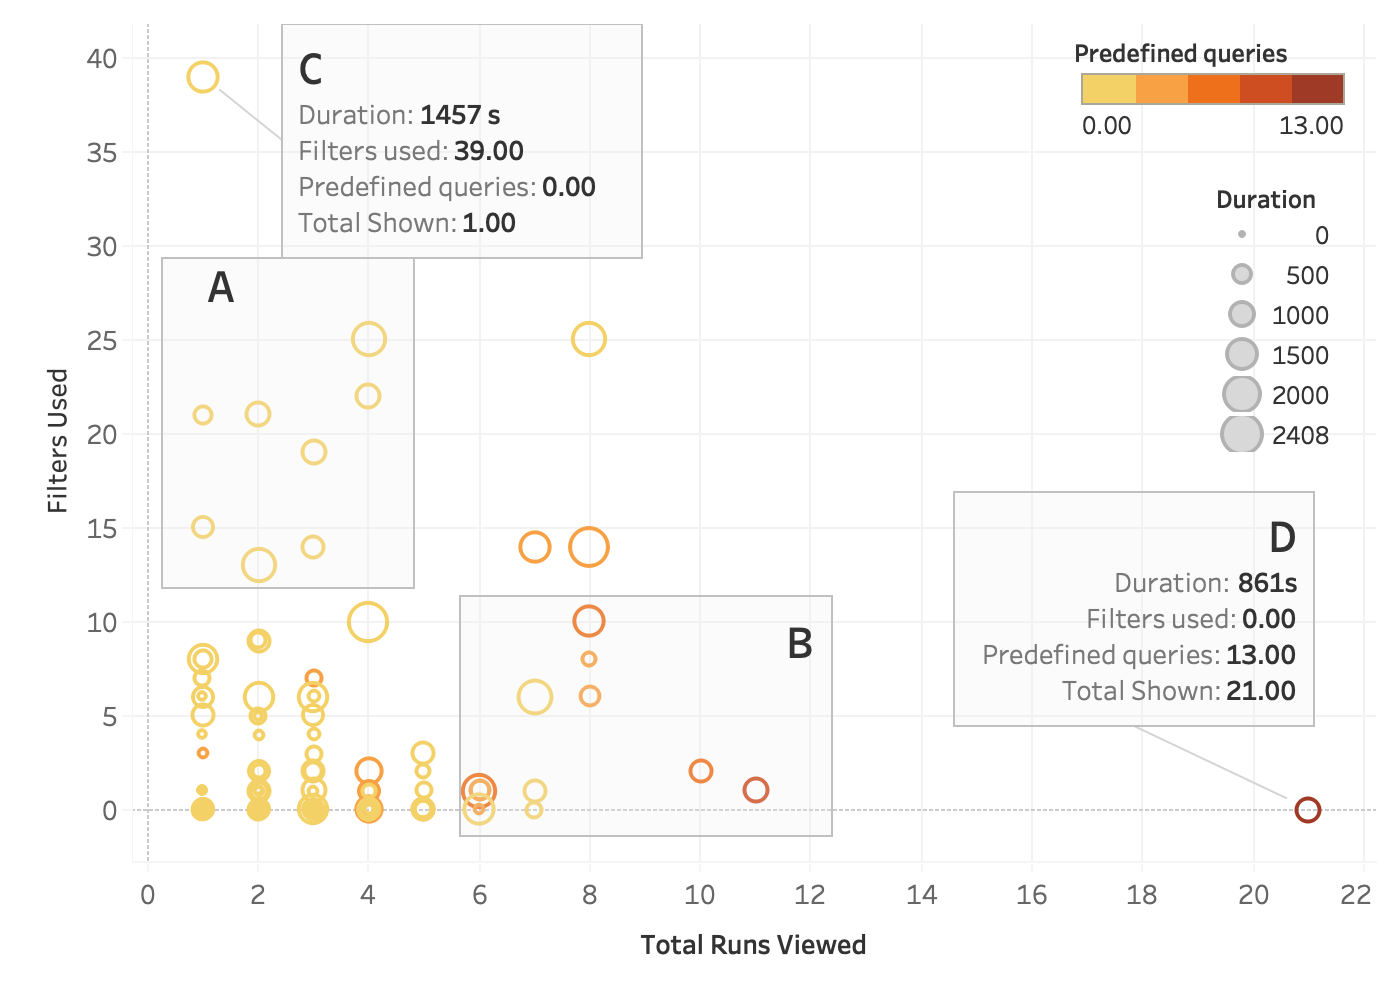
Using a rich mixed-method evaluation protocol during a three-week-long in-the-wild deployment, we captured the social and analytical impact of the public analytical visualization across 235 distinct interaction sessions. Our results demonstrate how the situated data visualization on a public display supported passers-by to create novel insights that were rather of casual nature. Several textual features that surrounded the visualization, such as titles that were framed as provocative hypotheses and predefined attention-grabbing data queries, sparked interest and social debate, while a narrative tutorial facilitated more analytical interaction patterns.
Publication
Coenen, J., & Vande Moere, A. (2021, June). Public Data Visualization: Analyzing Local Running Statistics on Situated Displays. In Computer Graphics Forum (Vol. 40, No. 3, pp. 159-171).